k-means Clustering
This page demonstrates k-means clustering with R.
> newiris <- iris
> newiris$Species <- NULL
Apply kmeans to newiris, and store the clustering result in kc. The cluster number is set to 3.
> (kc <- kmeans(newiris, 3))
K-means clustering with 3 clusters of sizes 38, 50, 62
Cluster means:
Sepal.Length Sepal.Width Petal.Length Petal.Width
1 6.850000 3.073684 5.742105 2.071053
2 5.006000 3.428000 1.462000 0.246000
3 5.901613 2.748387 4.393548 1.433871
Clustering vector:
[1] 2 2 2 2 2 2 2 2 2 2 2 2 2 2 2 2 2 2 2 2 2 2 2 2 2 2 2 2 2
[30] 2 2 2 2 2 2 2 2 2 2 2 2 2 2 2 2 2 2 2 2 2 3 3 1 3 3 3 3 3
[59] 3 3 3 3 3 3 3 3 3 3 3 3 3 3 3 3 3 3 3 1 3 3 3 3 3 3 3 3 3
[88] 3 3 3 3 3 3 3 3 3 3 3 3 3 1 3 1 1 1 1 3 1 1 1 1 1 1 3 3 1
[117] 1 1 1 3 1 3 1 3 1 1 3 3 1 1 1 1 1 3 1 1 1 1 3 1 1 1 3 1 1
[146] 1 3 1 1 3
Within cluster sum of squares by cluster:
[1] 23.87947 15.15100 39.82097
Available components:
[1] “cluster” “centers” “withinss” “size”
Compare the Species label with the clustering result
> table(iris$Species, kc$cluster)
1 2 3
setosa 0 50 0
versicolor 2 0 48
virginica 36 0 14
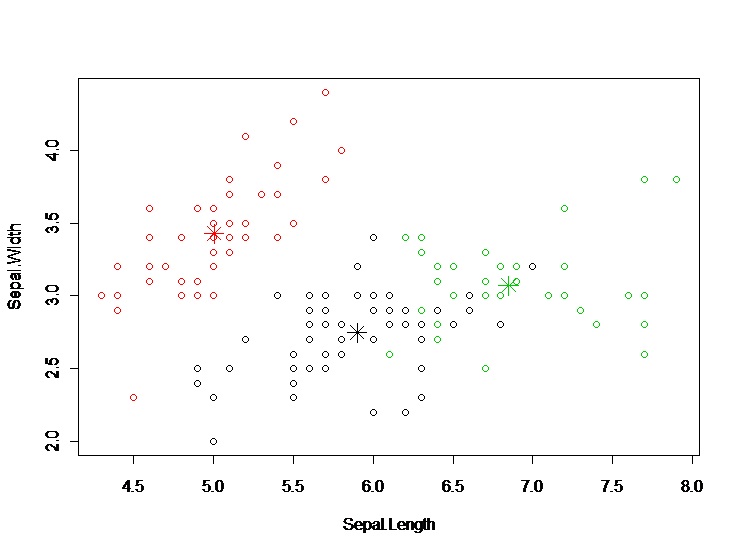
Plot the clusters and their centres. Note that there are four dimensions in the data and that only the first two dimensions are used to draw the plot below. Some black points close to the green centre (asterisk) are actually closer to the black centre in the four dimensional space.
> plot(newiris[c(“Sepal.Length”, “Sepal.Width”)], col=kc$cluster)
> points(kc$centers[,c(“Sepal.Length”, “Sepal.Width”)], col=1:3, pch=8, cex=2)
> plot(newiris[c(Sepal.Length, Sepal.Width)], col=kc$cluster)
> points(kc$centers[,c(Sepal.Length, Sepal.Width)], col=1:3, pch=8, cex=2)