Vizro is a toolkit for creating modular data visualization applications.
https://github.com/mckinsey/vizro
Visual Intelligence. Beautifully Engineered
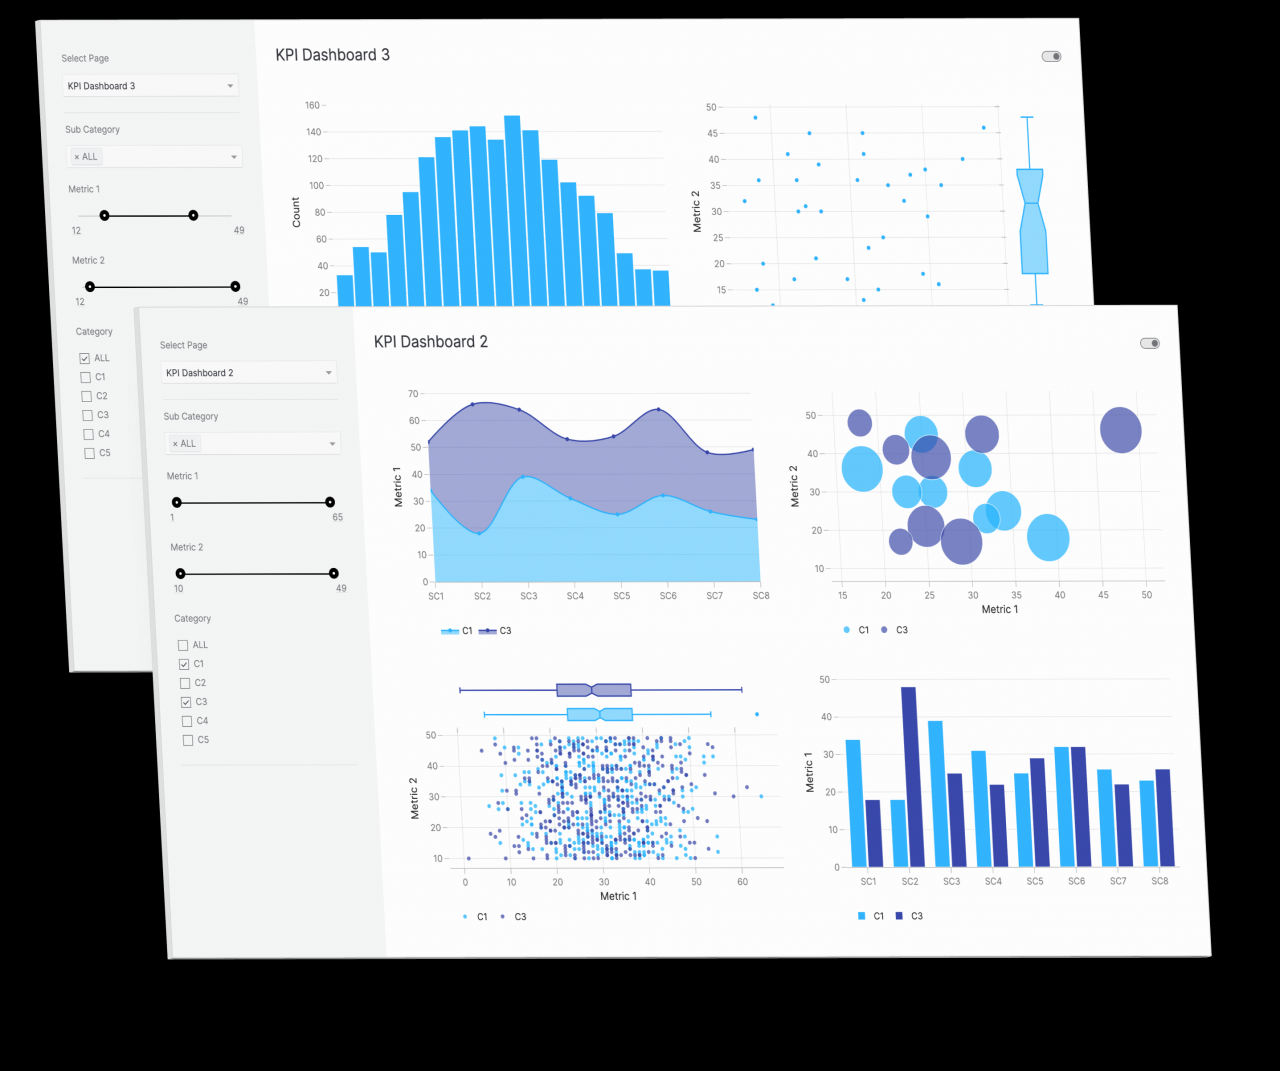
Vizro is a toolkit for creating modular data visualization applications

Rapidly self-serve the assembly of customized dashboards in minutes - without the need for advanced coding or design experience - to create flexible and scalable, Python-enabled data visualization applications.
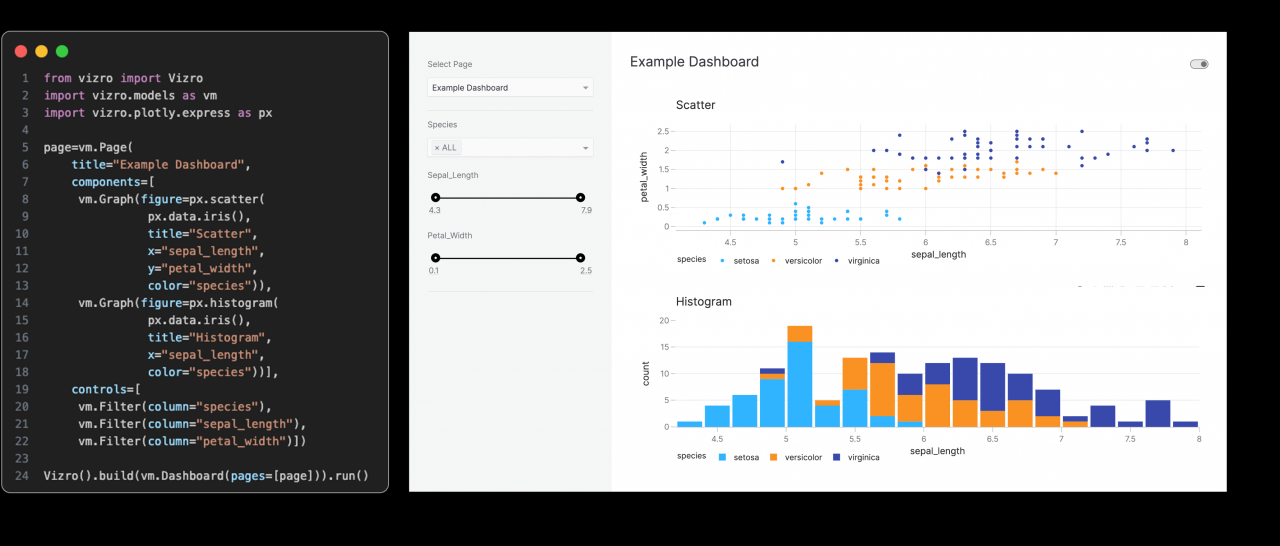
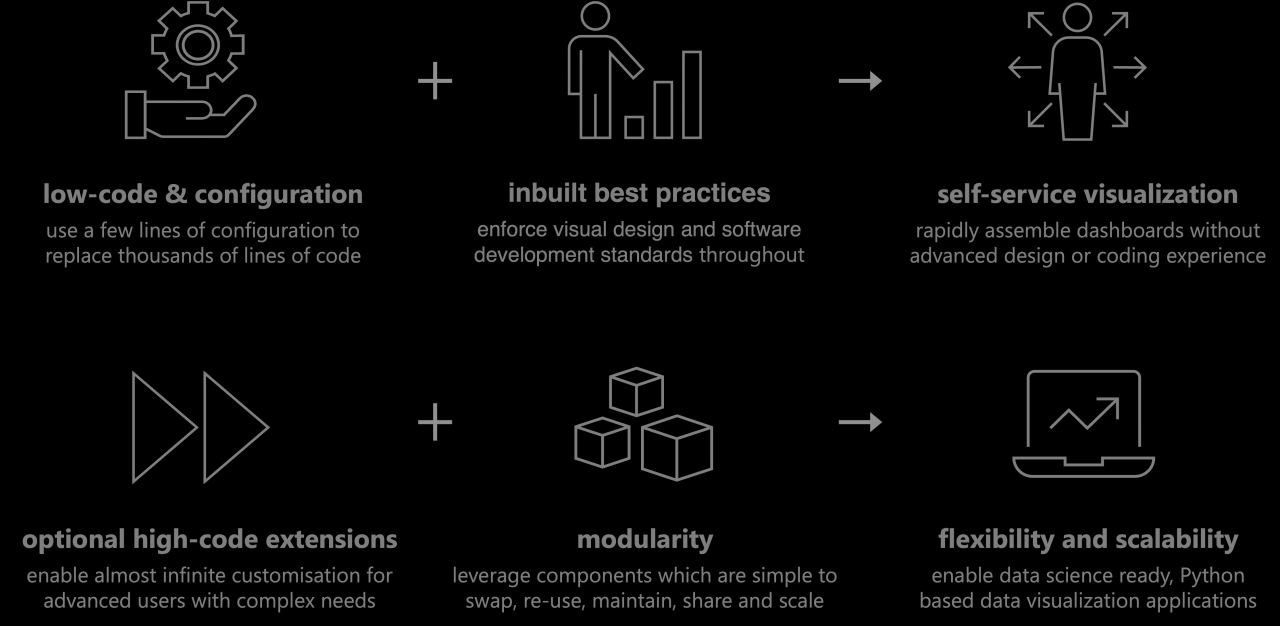
Use a few lines of simple configuration to create complex dashboards, which are automatically assembled using libraries such as Plotly and Dash, with inbuilt coding and design best practices.
Define high-level categories within the configuration, including:
- Components: create charts, tables, input/output interfaces, and more.
- Controls: create filters, parameter inputs, and custom action controllers.
- Pages, layouts and navigation: create multiple pages, with customizable layouts and flexible navigation across them.
- Actions and interactions: create interactions between charts, and use pre-defined or customized actions (such as exporting).
Configuration can be written in multiple formats including Pydantic models, JSON, YAML or Python dictionaries for added flexibility of implementation.
Optional high-code extensions enable almost infinite customization in a modular way, combining the best of low-code and high-code - for flexible and scalable, Python enabled data visualization applications.
Visit the "Why Vizro" section to see a more detailed explanation of Vizro use cases.
vizro-ai is a separate package and extends Vizro to enable the use of natural language queries to build Plotly charts.

See the Vizro-AI documentation for more details.
You can see Vizro in action by clicking on the following image or by visiting vizro.mckinsey.com.
