BNVIEWER — INTERACTIVE VISUALIZATION OF BAYESIAN NETWORKS
from http://robsonfernandes.net/bnviewer/
bnviewer is an R package for interactive visualization of Bayesian Networks based on bnlearn and visNetwork.
The bnviewer package learning algorithms of structure provided by the bnlearn package and enables interactive visualization through custom layouts as well as perform interactions with drag and drop, zoom and click operations on the vertices and edges of the network. In addition, the package allows to interpret the force of causal relations between the vertices of the Bayesian Network analyzed.
This package originated from my Master's project in Mathematics, Statistics and Applied Computing to Industry at the Institute of Mathematical and Computer Sciences of the University of São Paulo - ICMC-USP, under the supervision of Prof. Dr. Alneu Andrade Lopes and co-supervision of Dr. Brett Drury.
Support for the structure learning algorithms below:
Constraint-based structure learning algorithms:
- PC (the stable version);
- Grow-Shrink (GS);
- Incremental Association Markov Blanket (IAMB);
- Fast Incremental Association (Fast-IAMB);
- Interleaved Incremental Association (Inter-IAMB);
- Max-Min Parents & Children (MMPC);
- Semi-Interleaved Hiton-PC (SI-HITON-PC);
Score-based structure learning algorithms:
- Hill Climbing (HC);
- Tabu Search (Tabu);
Hybrid structure learning algorithms:
- Max-Min Hill Climbing (MMHC);
- General 2-Phase Restricted Maximization (RSMAX2);
Local discovery algorithms:
- Chow-Liu;
- ARACNE;
Usage
viewer(bayesianNetwork, bayesianNetwork.title = "",
bayesianNetwork.subtitle = "", bayesianNetwork.footer = "",
bayesianNetwork.layout = "default", bayesianNetwork.width = "100%",
bayesianNetwork.height = "500px", node.shape = c("dot"),
node.label.prefix = "", node.colors = list(), edges.smooth = TRUE,
edges.dashes = FALSE, options.highlightNearest = TRUE,
options.nodesIdSelection = FALSE)
Arguments
|
A Bayesian Network structure. (Example : hill-climbing (HC)). |
|
: String. Bayesian Network title |
|
: String. Bayesian Network subtitle |
|
: String. Bayesian Network footer |
|
: String. A layout of a Bayesian Network
|
|
: String. Bayesian Network width |
|
: String. Bayesian Network height |
|
: String. A node shape of a Bayesian Network
|
|
: String. Adds a prefix to the node label |
|
: String | named list. Color for the node. Can be 'rgba(120,32,14,1)', '#97C2FC' (hexa notation on 7 char without transparency) or 'red'. Can be just one color, or a list with several elements:
|
|
: Boolean. When true, the edge is drawn as a dynamic quadratic bezier curve. |
|
: Array or Boolean. Default to false. When true, the edge will be drawn as a dashed line. |
|
: Boolean. Default to true. Highlight nearest when clicking a node. |
|
: Boolean. Default to false. Add an id node selection creating an HTML select element. |
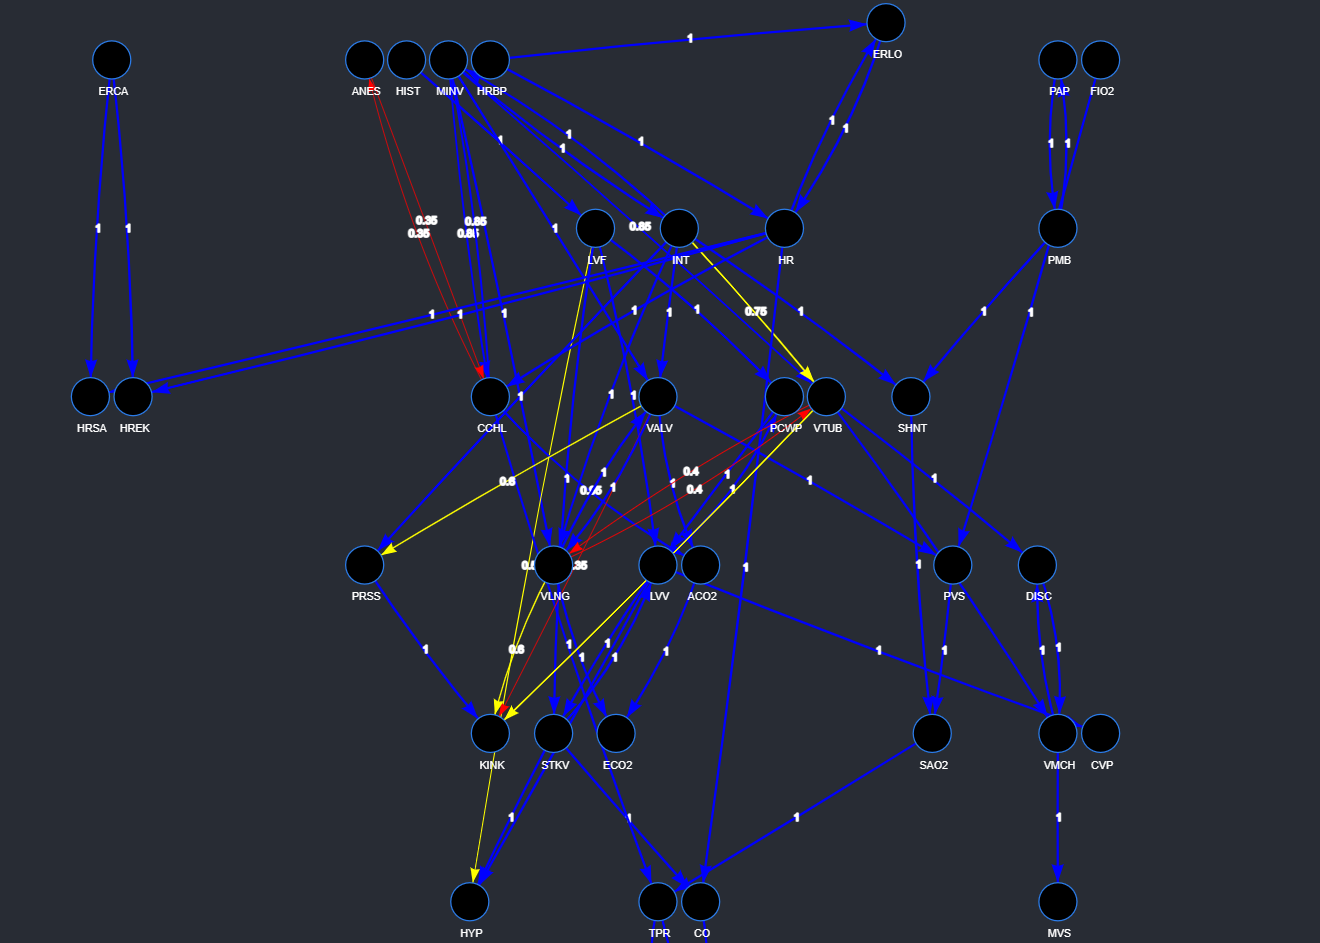
{strength.viewer} Function. Interactive Bayesian Network Strength Viewer
Usage
strength.viewer(bayesianNetwork, bayesianNetwork.background = NULL,
bayesianNetwork.boot.strength = NULL,
bayesianNetwork.arc.strength.threshold.expression = NULL,
bayesianNetwork.arc.strength.threshold.expression.color = NULL,
bayesianNetwork.arc.strength.threshold.alternative.color = NULL,
bayesianNetwork.arc.strength.label = FALSE,
bayesianNetwork.arc.strength.label.prefix = "",
bayesianNetwork.arc.strength.label.color = NULL,
bayesianNetwork.arc.strength.tooltip = FALSE,
bayesianNetwork.edge.scale.min = 1,
bayesianNetwork.edge.scale.max = 5,
bayesianNetwork.edge.scale.label.min = 14,
bayesianNetwork.edge.scale.label.max = 14,
bayesianNetwork.title = "", bayesianNetwork.subtitle = "",
bayesianNetwork.footer = "", bayesianNetwork.layout = "default",
bayesianNetwork.width = "100%", bayesianNetwork.height = "500px",
node.shape = c("dot"), node.label.prefix = "",
node.colors = list(), node.font = list(), edges.smooth = TRUE,
edges.dashes = FALSE, edges.colors = list(),
options.highlightNearest = TRUE, options.nodesIdSelection = FALSE)
Arguments
|
A Bayesian Network structure from Averaged Network |
|
Bayesian network background |
|
A nonparametric bootstrap to assess arc strength and direction |
|
Logical expression of the force threshold of the arcs of the Bayesian network |
|
Color applied to logical expression of the force threshold of the arcs of the Bayesian network |
|
Alternative color to logical expression of the force threshold of the arcs of the Bayesian network |
|
Enable Bayesian Network arc strength label |
|
Include Bayesian Network arc strength label prefix |
|
Set Bayesian Network arc strength label color |
|
Enable Bayesian Network arc strength tooltip |
|
Set bayesian Network edge scale minimum |
|
Set bayesian Network edge scale maximum |
|
Set bayesian Network edge scale label minimum |
|
Set bayesian Network edge scale label maximum |
|
: String. Bayesian Network title |
|
: String. Bayesian Network subtitle |
|
: String. Bayesian Network footer |
|
: String. A layout of a Bayesian Network
|
|
: String. Bayesian Network width |
|
: String. Bayesian Network height |
|
: String. A node shape of a Bayesian Network
|
|
: String. Adds a prefix to the node label |
|
: String | named list. Color for the node. Can be 'rgba(120,32,14,1)', '#97C2FC' (hexa notation on 7 char without transparency) or 'red'. Can be just one color, or a list with several elements:
|
|
Node Font : Array. Example list(color = "black", face="Arial") |
|
: Boolean. When true, the edge is drawn as a dynamic quadratic bezier curve. |
|
: Array or Boolean. Default to false. When true, the edge will be drawn as a dashed line. |
|
: Named list or String. Default to named list. Color information of the edge in every situation. Can be 'rgba(120,32,14,1)', '#97C2FC' (hexa notation on 7 char without transparency) or 'red'.
|
|
: Boolean. Default to true. Highlight nearest when clicking a node. |
|
: Boolean. Default to false. Add an id node selection creating an HTML select element. |