可视化数据分析工具:Perspective
推荐 GitHub 上一个交互式、可视化数据分析工具:Perspective,可用于创建数据报告、数据面板、科研笔记及应用。
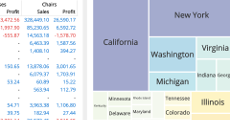
为了便于开发者与数据科学家上手使用,开发团队还提供了十几个案例供参考学习,其中包含电影、超市、地铁、流媒体等多个分类。
Perspective is an interactive analytics and data visualization component, which is especially well-suited for large and/or streaming datasets. Originally developed at J.P. Morgan and open-sourced through the Fintech Open Source Foundation (FINOS), Perspective makes it simple to build user-configurable analytics entirely in the browser, or in concert with Python and Jupyterlab. Use it to create reports, dashboards, notebooks and applications, with static data or streaming updates via Apache Arrow.
-
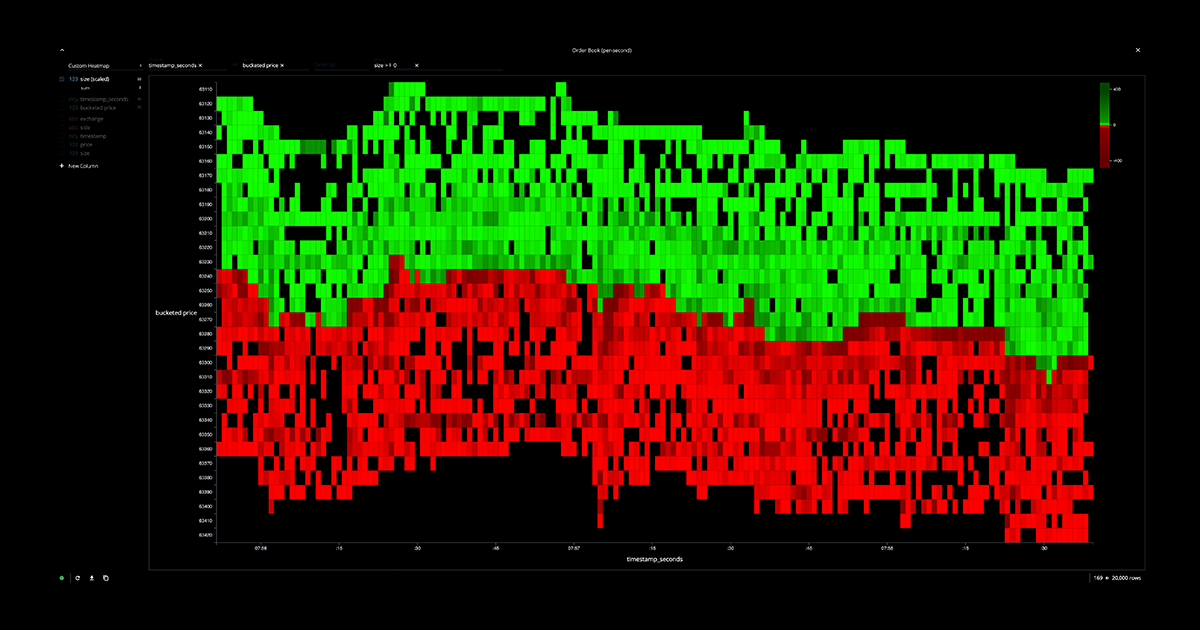
A fast, memory efficient streaming query engine, written in C++ and compiled for both WebAssembly and Python with support for (read/write/stream)ing Apache Arrow, and a high-performance columnar expression language based on ExprTK.
-
A framework-agnostic User Interface Custom Element, powered either in-browser via WebWorker (WebAssembly) or virtually via WebSocket server (Python/Node), as well as a suite of Datagrid and D3FC Chart plugins.
-
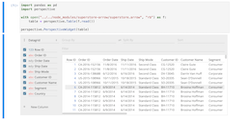
A JupyterLab widget and Python client library, for interactive data analysis in a notebook, as well as scalable production Voila and Holoviz applications.

Examples
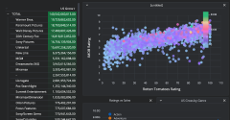
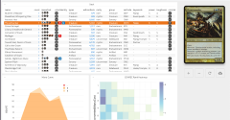
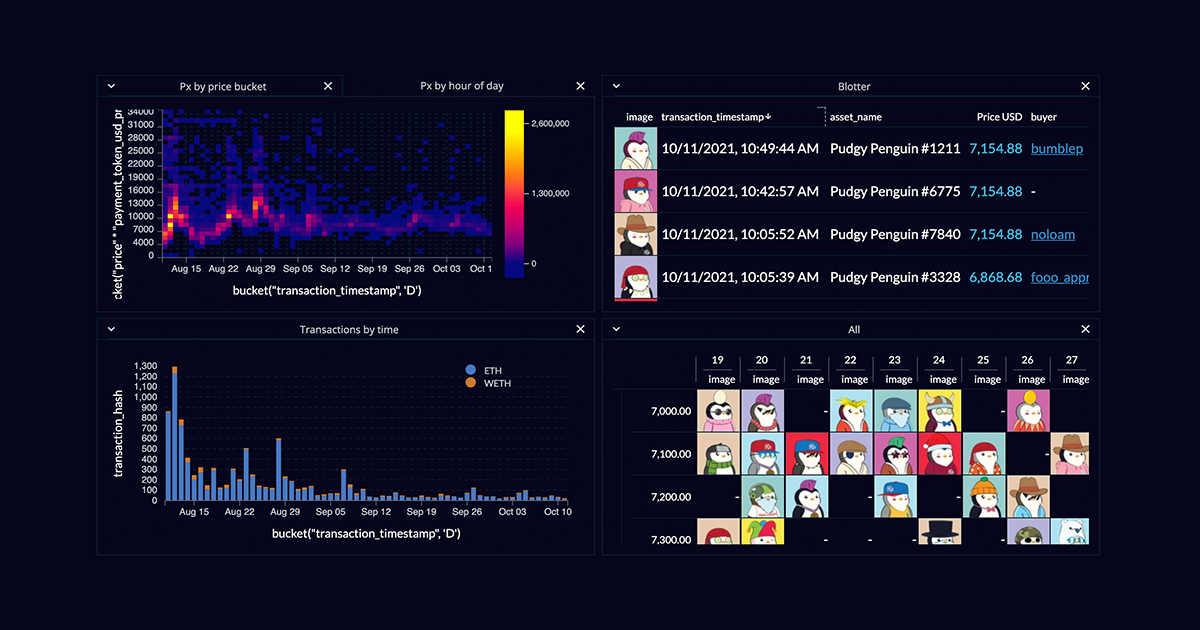
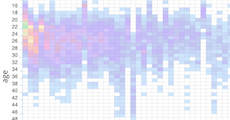
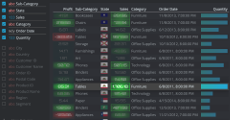
| Movies | Magic | NFT |
 |
 |
 |
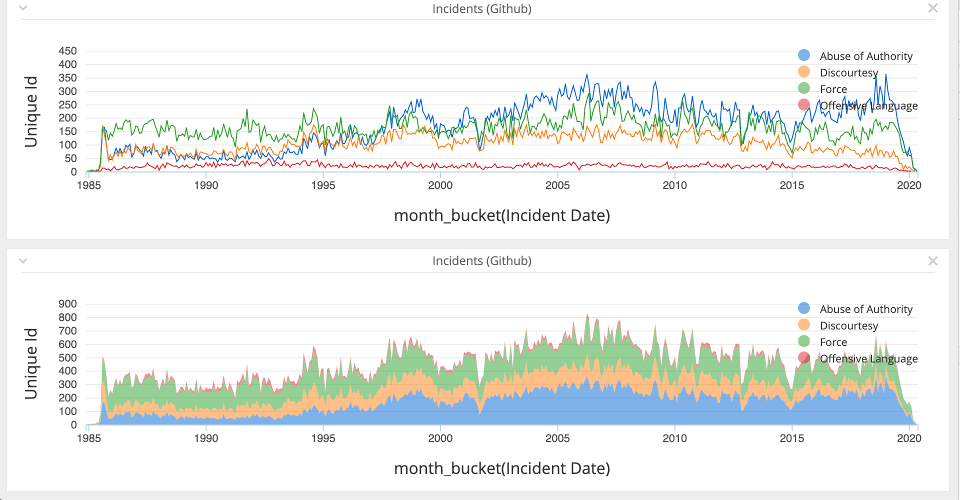
| NYPD CCRB | Olympics | COVID |
 |
 |
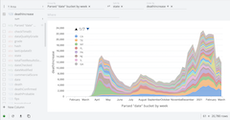 |
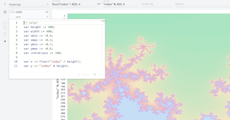
| Custom Styles | BTC | Fractal |
 |
 |
 |
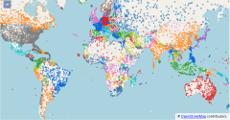
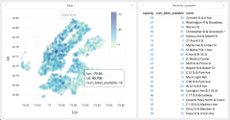
| Editable | Maps Airports | Streaming |
 |
 |
 |
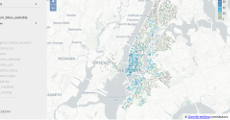
| NYC Citibike | JupyterLab Plugin | Maps Citibike |
 |
 |
 |
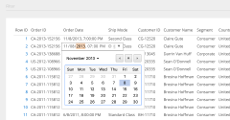
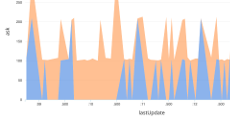
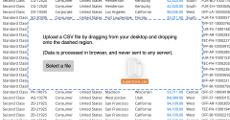
| Polygon.io | CSV | Superstore |
 |
 |
 |