
加载数据
from matplotlib import pyplot as plt
from sklearn import datasets
from sklearn.tree import DecisionTreeClassifier
from sklearn import tree

# Prepare the data data
iris = datasets.load_iris()
X = iris.data
y = iris.target

# Fit the classifier with default hyper-parameters
clf = DecisionTreeClassifier(random_state=1234)
model = clf.fit(X, y)
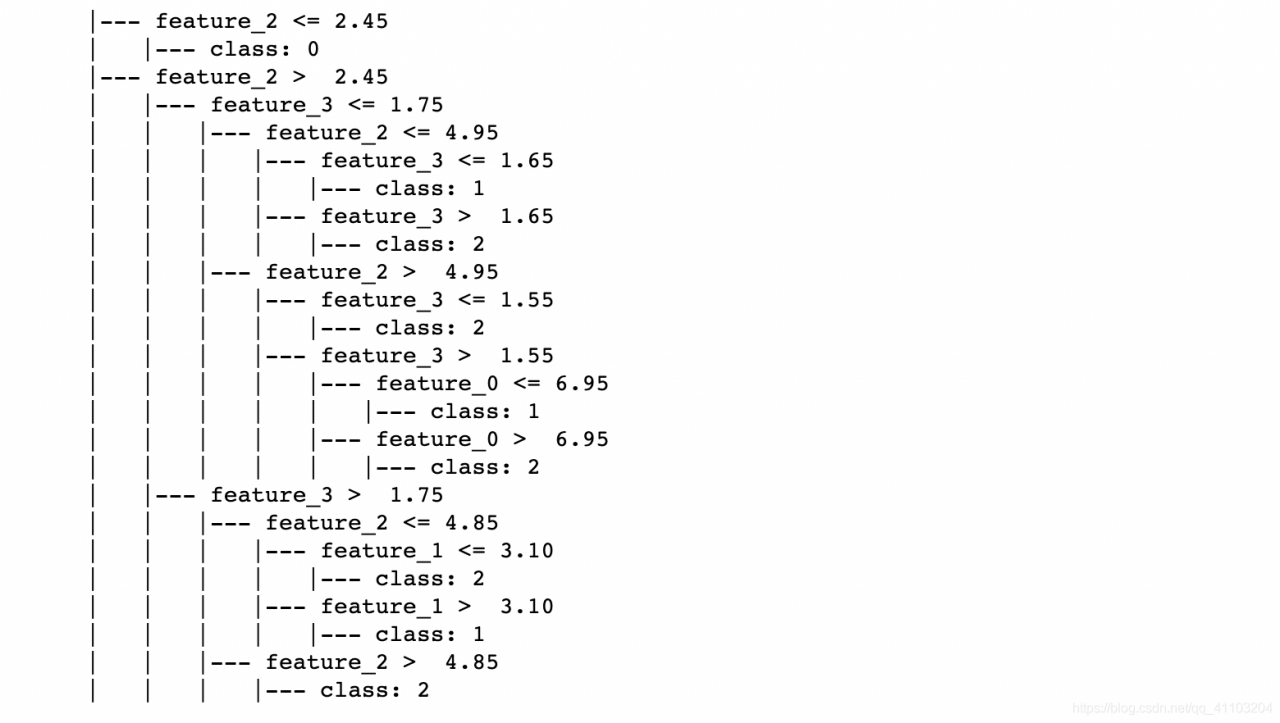
以文本的形式显示决策树规则
text_representation = tree.export_text(clf)
print(text_representation)

# Save rules
with open(os.path.join(DATA_DIR, "decistion_tree.log"), "w") as fout:
    fout.write(text_representation)
输出如下
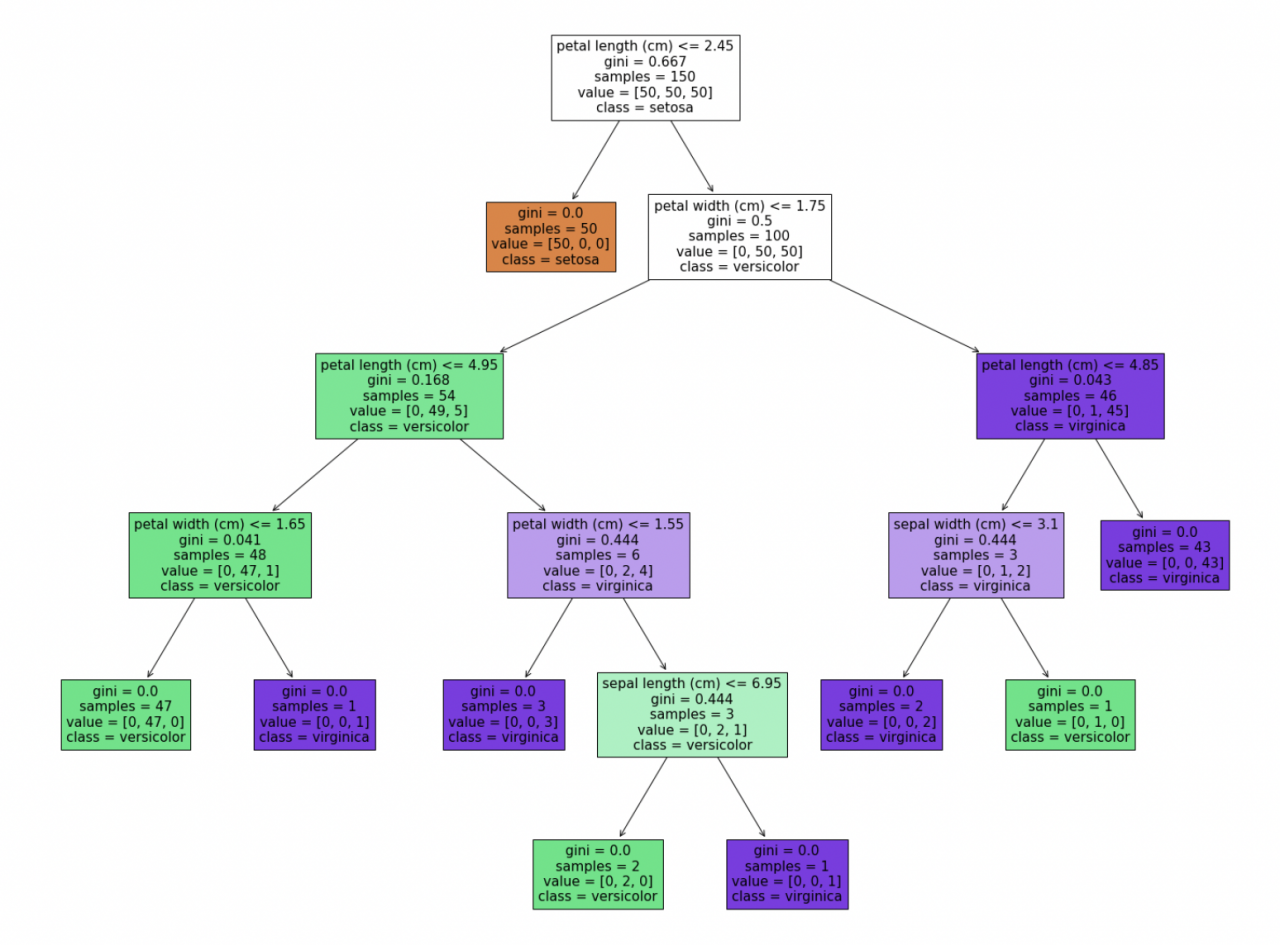
决策树可视化
fig = plt.figure(figsize=(25,20))
_ = tree.plot_tree(
    clf,
    feature_names=iris.feature_names,
    class_names=iris.target_names,
    filled=True
)

# Save picture
fig.savefig("decistion_tree.png")
可视化效果如下:
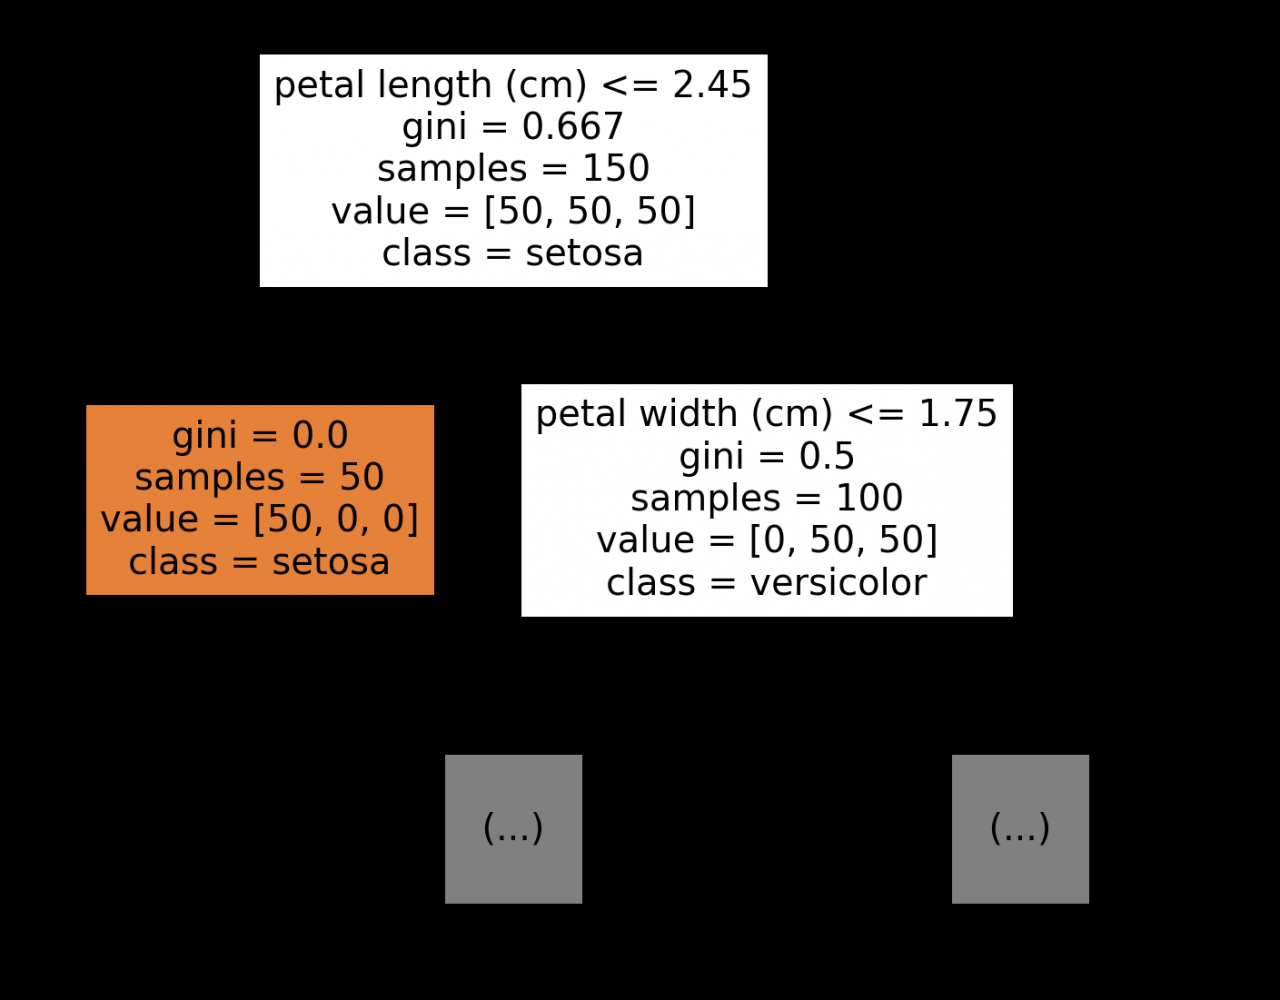
关键参数
max_depth(default=None):最大深度。当决策树过深的时候可以只画一部分。
fig = plt.figure(figsize=(25,20))
_ = tree.plot_tree(
    clf,
    feature_names=iris.feature_names,
    class_names=iris.target_names,
    filled=True,
    max_depth=1
)
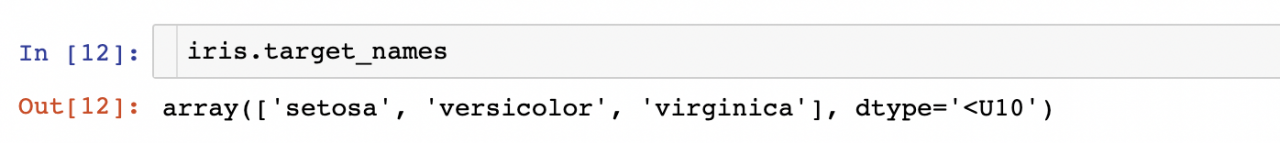
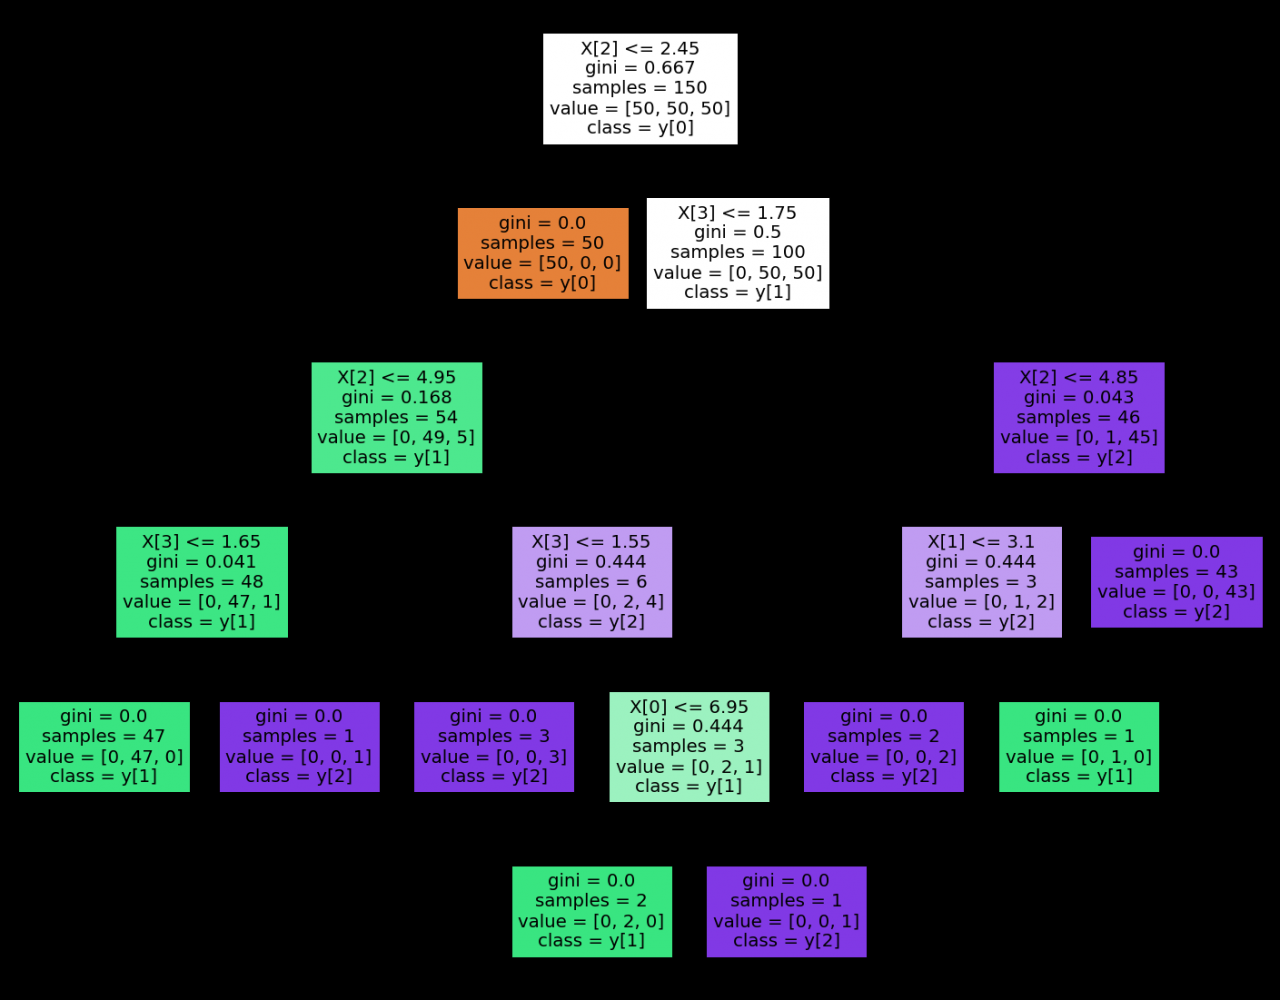
class_names: list of str or bool, default=None
这个参数值只和分类问题有关。如果填入标签名称的话,那么就会用名称表示;如果是True的话,就会用编码来表示标签(也就是 “y[0]”, “y[1]”, …)——升序排列
fig = plt.figure(figsize=(25,20))
_ = tree.plot_tree(
    clf,
    feature_names=iris.feature_names,
    class_names=True,
    filled=True
)
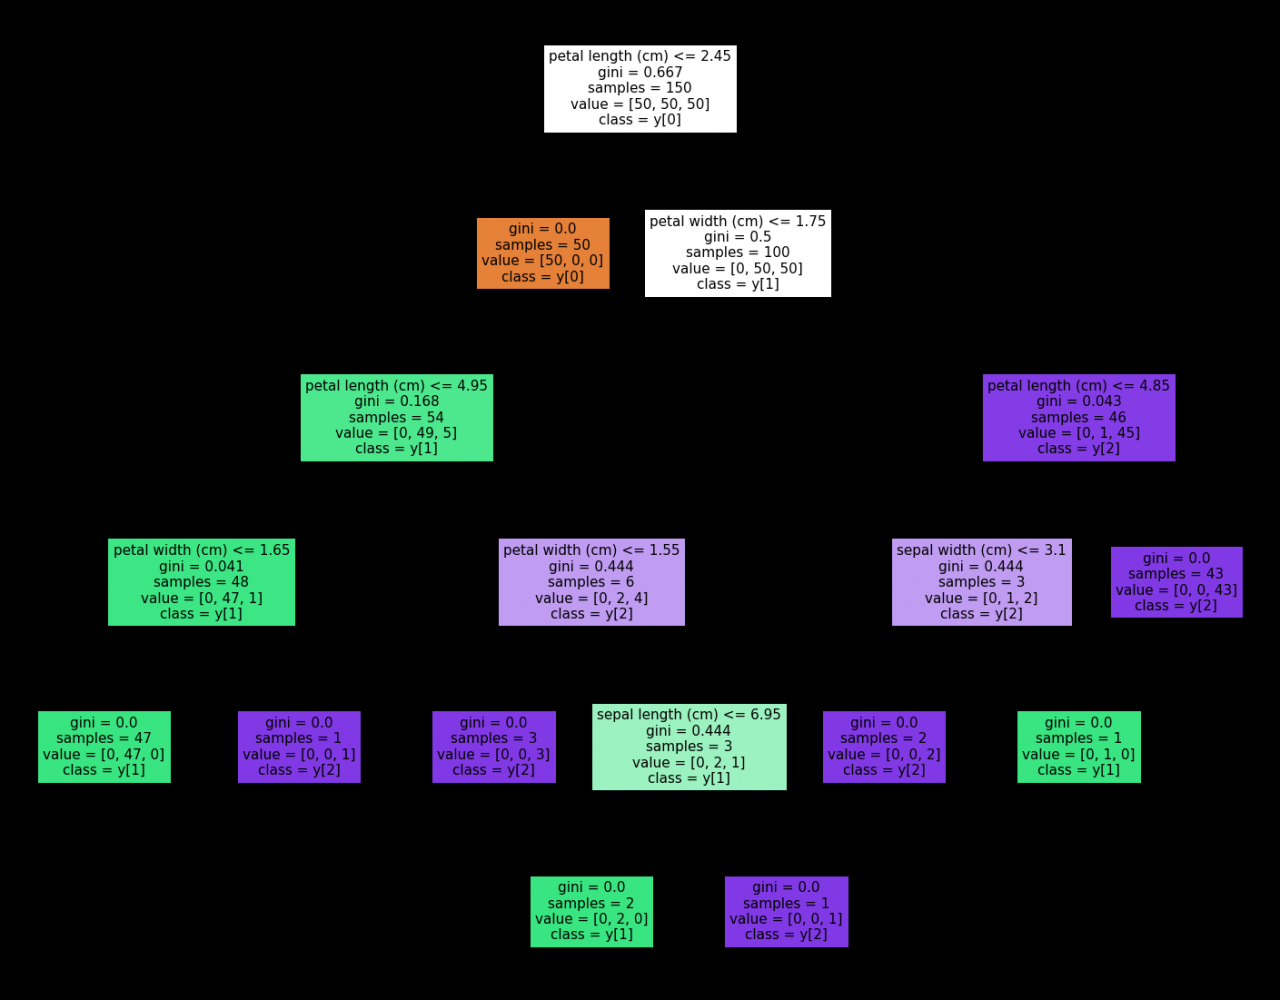
注意我们原先填入的标签名称为
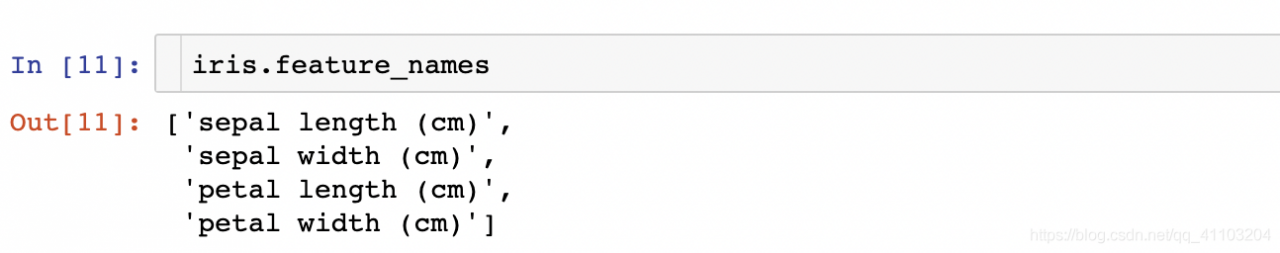
feature_names: list of strings, default=None
如果填入特征的名称的话,就会用特征名称表示;如果设置为None,那么就会用(“X[0]”, “X[1]”, …)来进行表示(同class_names)
fig = plt.figure(figsize=(25,20))
_ = tree.plot_tree(
    clf,
    feature_names=None,
    class_names=True,
    filled=True
)
 注意我们原先填入的特征名称为
可视化解释
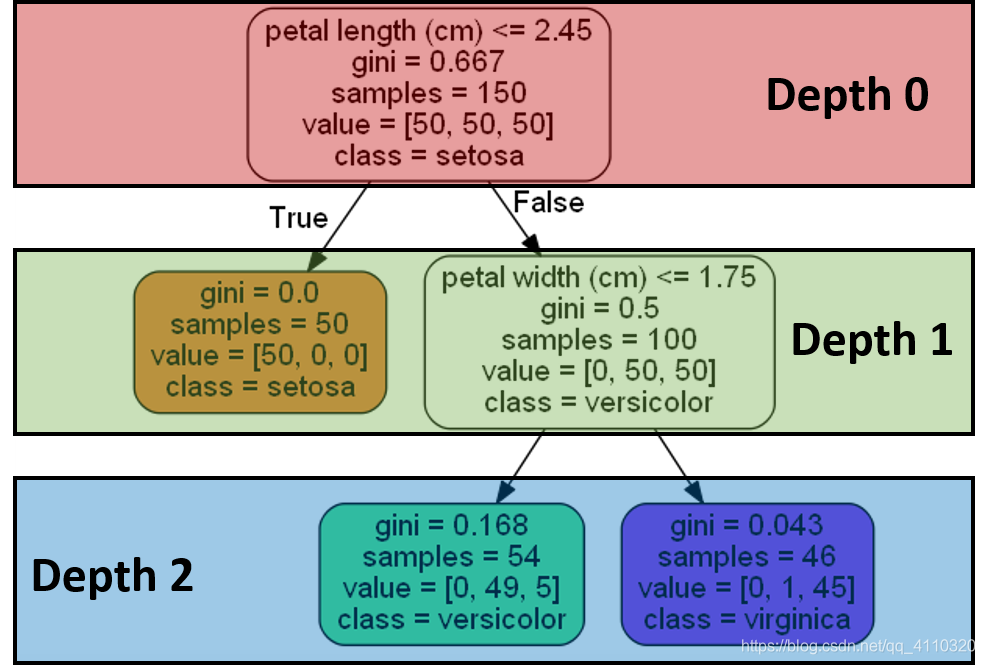
gini基尼不纯度(gini impurity):用来衡量节点的纯度。具体来说,如果我们根据数据集的标签分布情况,来判断样本的标签,那么判断错的概率就是gini impurity。因此公式如下。
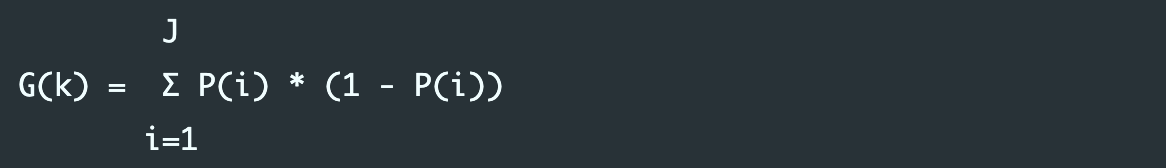 如果gini是0,表示该节点是“纯的”,也就是说该节点的样本全都属于同一类;如果是大于0的,那么说明该节点中的样本属于不同的类。gini越大,就代表“混乱”的程度越大,也就是每种类型出现的程度越相近。比如,P1=0.5,P2 = 1 – P1 = 0.5,gini = 0.25 + 0.25 = 0.5;P1=0.9,P2 = 1 – P1 = 0.1,gini = 0.09 + 0.09 = 0.18。
samples:当前节点所包含的样本数量。比如上图中,Depth 0中,包含150个样本,Depth1的右边节点,包含100个样本。
values:表示在当前节点的样本中,分别属于三个类别的样本数量有多少。比如目前这个图是个3分类问题,那么属于类别【s,ve,vi】的分别有【50,50,50】。
class:表示如果当前节点会把样本判断属于哪个标签。比如Depth2的左边节点,这个时候节点就根据样本的分布(第二个标签ve的样本最多),然后判断样本都属于ve标签下。
参考资料:
https://scikit-learn.org/stable/modules/generated/sklearn.tree.plot_tree.html?highlight=plot_tree#sklearn.tree.plot_tree
https://scikit-learn.org/stable/modules/generated/sklearn.tree.export_text.html
https://mljar.com/blog/visualize-decision-tree/